
Statistics
Hypothesis testing, p-value, types of t-test, and much more
Inferential Statistics
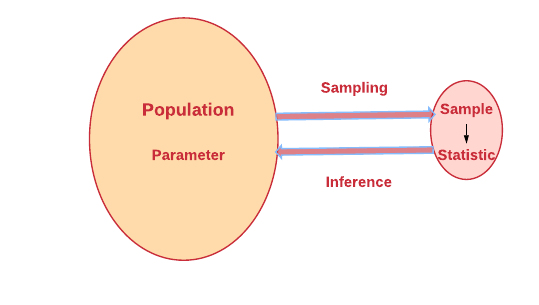
Inferential statistics allow you to draw inferences about the population from the sample. It is used to estimate population parameters from sample statistics.
Hypothesis testing is one of the methodologies of inferential statistics.
Let’s learn about hypothesis testing in this article.
Topics covered in this article.

What is Population, Parameter, Sample, Statistic?
Population → The population is the entire set of all possible values from which we have to draw a conclusion.
Ex. Every person who is having diabetes in the whole world. Suppose we want to infer some data from this population, like the average age of a person having diabetes. Typically it’s impossible to measure the entire population. So we draw a random sample from this population.
Sample → The sample is a subset of the population. The sample is the specific group from which we will collect data from. Sample size(n) will be less than the size of the population(N) from which it is taken.
Ex. Selecting a few people having diabetes from the population.
Parameter → It is a numerical value that describes the characteristics of the entire population.
Ex. Population Mean μ
Statistic → It is a numerical value that describes the characteristics of the sample.
Ex. Sample Mean x̄
Hypothesis testing
Hypothesis testing is done to test the assumptions which are taken based on observations and experiments.
Two parts of hypothesis testing
- Null hypothesis
- Alternate hypothesis
Null hypothesis
Null hypothesis is always used to accept the fact/assumption. It is denoted as Hₒ
Alternate hypothesis
An alternate hypothesis is used to contradict the assumptions. It is denoted as Hₐ
Example of the null hypothesis and alternate hypothesis
Suppose a retailer is selling apple juice in 32 fl oz bottles. A customer has complained that the apple juice he bought previously weighed under 32 fl oz.
What is the hull hypothesis and alternate hypothesis?
From the retailer’s perspective, he is confident that he sells 32 fl oz apple juice.
Hₒ μ=32
The alternate hypothesis is customer complaints; it is less than 32 fl oz.
Hₐ μ< 32
In an alternate hypothesis, there may be a two-tail test or one-tail test.
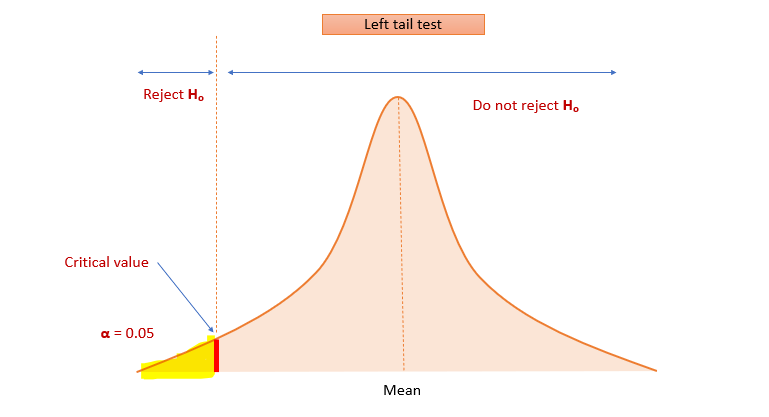
One tail test
In our example, the alternate hypothesis is a one-tail test. Hₐ μ< 32
Here we are concentrating on only one side (less than mean). This is known as a left tailed test.
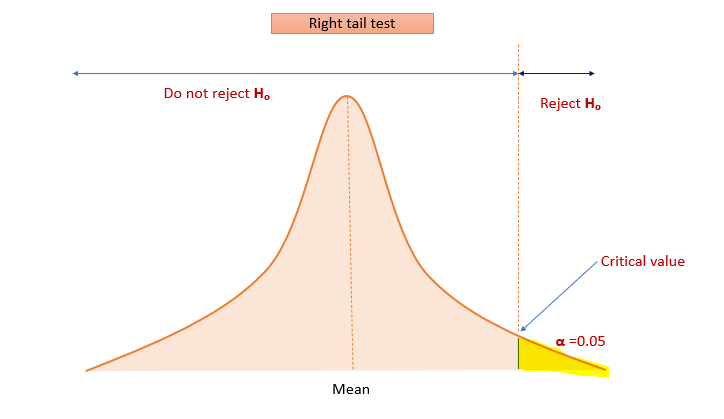
Right tail test
Example:
Hₒ μ ≤32
Hₐ μ>32
Here we are concentrating on only one side (greater than mean). This is known as a right-tailed test.
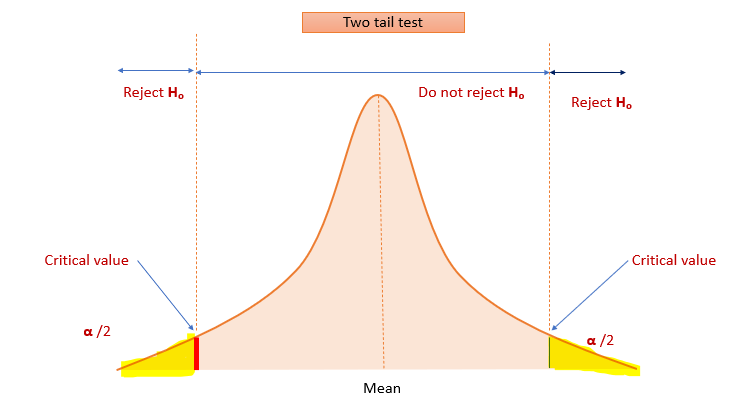
Two tail test
A test that is conducted to show whether the mean of the sample is significantly greater than and significantly less than the mean of a population is considered a two–tailed test
Ex. If Hₒ μ=32 and Hₐ μ≠ 32
Here alternate hypothesis is two-tailed. We are concentrating on both sides.[less than mean and greater than mean]
Type I Error and Type II Error
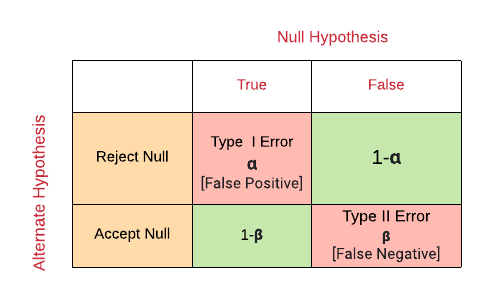
Type I Error
Type I Error occurs when the researcher rejects the null hypothesis when it is true. The probability of rejecting a null hypothesis when it is true is known as the significance level. It is denoted by α
Significance Level
The maximum probability of Type I Error is called alpha. Before we do any statistical test, we have to determine the α value.
In most cases, the alpha value will be 0.05.
It means we are 95% confident that we made the right decision.[Subtracting alpha level 5%(0.05) from 100% gives the confidence level]
α is 0.05 means Only a 5% chance is there that we would reject the null hypothesis when it is true.
For some cases in the medical field, like testing a new drug, we should be at least 99% confident. For such cases, the alpha value is set as 0.01.
Like all probabilities, the alpha value ranges from 0 to 1.
Type II Error
Type II Error occurs when the researcher fails to reject the null hypothesis when it is false. The probability of making a type II error is called β (beta)
What is the p-value?
P-value means the probability value that is used to determine whether to reject or not to reject the null hypothesis.
The researcher determines the α value. If the α value is set as 0.05 means 95% confident about the decision.[Subtracting alpha level 5%(0.05) from 100% gives the confidence level]
After performing the hypothesis test, we will get a p-value.
If p≤0.05 means reject the null hypothesis.
If p>0.05 means do not reject the null hypothesis.
Hypothesis testing for large and small samples
- t-test → Small samples
- Z test → Large samples
Student’s t-test
- William Sealy Gosset developed the t distribution and published it under the pen name “Student.”
- Student’s t-test is used when the sample size is less than or equal to 30
and when the population standard deviation is unknown.
Types of t-test
- One sample t-test
- Unpaired two samples t-test
- Paired t-test
One sample t-test
- It is used to test whether the sample mean is statistically different from the population mean when the standard deviation of the population is unknown.
- It is used to compare one data distribution against a single fixed value.
- One distribution vs. hypothesized mean
- The test variable should be continuous(i.e., interval or ratio level)
Formula:
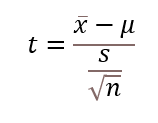
x̄ →sample mean
μ →population mean
n → sample size
s → sample standard deviation
df= n-1
df=degrees of freedom
Degrees of freedom
t-test uses degrees of freedom.
Degrees of freedom refers to the number of values involved in the calculation that are free to vary.
Example: Suppose the mean of 3 numbers is 6. If x1 =5 and x2= 6, what is x3?
x3 will be 7, which is not free to vary. So df=2
Here n=3, so df= n-1=2
Example of one sample t-test
A car company claims that their new car model averages 31mpg. You randomly select 10 cars of that particular model from a local car dealership and test their mileage. Then test whether the actual gas mileage of these cars deviates significantly from 31.
Formula
x̄ →sample mean
μ →population mean
n → sample size
s → sample standard deviation
Step 1. Define Hₒ and Hₐ
Null hypothesis Hₒ x̄=μ
[Sample mean is equal to population mean]
Alternate hypothesis Hₐ x̄ ≠ μ
Step 2. Specify the significance level α. Normally α level is set as 5% (α=0.05)
Step 3: Calculate t-statistic using the formula
Step 4: Calculate the degree of freedom
df=n-1. In this example, sample size=10. So df=9.
Step 5: Interpretation
Compare t-critical and t-statistic
t-critical is calculated from the t-table for df =9 and α=0.05/2.
Since it is a two-tailed test, the significance level is divided by 2 for calculating the t-critical value.
If the t–statistic value is greater than the t–critical, then the null hypothesis is rejected. Otherwise, the null hypothesis is accepted.
Unpaired two samples t-test
Independent/unpaired two-sample t-test is used to compare the mean of two unrelated groups on the same continuous variable.
Example: Calculate the mean salary of females and the mean salary of males in an organization and compare whether the mean of both the groups are the same or not.
Paired t-test
A paired t-test compares the mean of the same groups under two different scenarios.
Example: Comparing student’s scores in exams before and after training.
Z test
Z test is a statistical way of testing a hypothesis
1. When the standard deviation of the population is unknown, and the sample size is greater than 30.
2. When we know the standard deviation of the population.
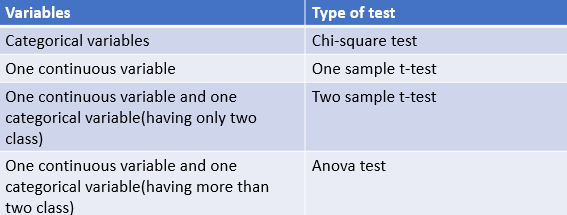
Chi-Square test of independence
Chi-square test of independence is used to test the independence between two categorical variables of the same population.
When to use which test?
I hope that you have found this article helpful. Thanks for reading!
Make a one-time donation
Make a monthly donation
Make a yearly donation
Choose an amount
Or enter a custom amount
Your contribution is appreciated.
Your contribution is appreciated.
Your contribution is appreciated.
