Statistics
p-value approach, critical value approach, confidence interval approach

Hypothesis Testing
Hypothesis testing is used to determine whether the assumption about the value of the population parameter should be rejected or not.
Population parameters like population mean, population variance, population proportion, etc.
There are different types of hypothesis testing and different approaches to perform hypothesis testing.
Let’s learn about this in detail in this article.
Steps in Hypothesis Testing
- Formulate the null and alternative hypothesis
- Specify the level of significance
- Determine the type of testing
a) one sample or two-sample test
b) one tail/ two-tail test
c) Test of mean/variance/proportion - Compute the test statistic
- Use either the p-value approach/critical value approach/confidence level approach to make a decision → to reject or not to reject the null hypothesis
Types of hypothesis testing
- Null Hypothesis →Does not challenge the status quo
- Alternative Hypothesis → Challenges the status quo
status quo means how things are now. Current situation/accepted norm.
Formulating Null and Alternative Hypothesis
The null hypothesis is always formulated in such a way that the assumption is true. If we fail to reject the null hypothesis means no follow-up action is required.
Example: Milk Packet is labeled as 500 ml. But the customer complained that the quantity is less than 500 ml.
The null hypothesis is formulated according to the accepted norm. Here milk packet is labeled as 500 ml.
Null Hypothesis Hₒ → μ= 500
Null hypothesis always have an equality sign (= or ≥ or ≤)
[ So, if we fail to reject the null hypothesis, no follow-up is required. The company no need to take further action. But if we rejected the null hypothesis, the company has to take corrective actions ]
Alternative Hypothesis Hₐ → μ!=500
Step 1 in Hypothesis Testing: Formulate the null and alternative hypothesis
Types of Error
- Type I Error →Rejection of null hypothesis when it should not be rejected. It is denoted by α
2. Type II Error →Fail to reject the null hypothesis when it should be rejected. It is denoted by β
Level of significance, Confidence Level
The level of significance is denoted by α. It is our tolerance level in making a Type I error which means the probability of rejecting the null hypothesis when it is true.
In most cases, α is set as 0.05
Confidence Level= 1-α.
Confidence Level indicates how certain or how confident you can be about the decision. If α is 0.05 means, confidence level = 1–0.05 → 0.95.
The confidence level is 95%.
Step 2 in Hypothesis Testing, specify the α value
Types of Hypothesis Testing
After formulating hypothesis testing, we have to check the type of testing.
- One sample/ two sample
- Test of mean, variance, proportion
- One tail/two-tail
One tail/two-tail
One-tail or two-tail test depends on the sign of the alternate hypothesis.
- If there is not equal sign in the alternate hypothesis means, it’s a two-tail test. Otherwise, it’s a one-tail test
- One tail test can be either left tail/right tail.
- If the alternative hypothesis has a greater than sign, it’s an upper tail /right tail test.
- If the alternative hypothesis has a less than sign, it’s a lower tail /left tail test.
Test of the population mean will be in one of the three forms.
- Null Hypothesis →Population mean equal to the hypothesized mean → Two tail test
Hₒ → μ= μₒ
Hₐ → μ!= μₒ

Here, we have to check both sides. The rejection region is on both sides.
2. Null hypothesis → Population mean is less than or equal to hypothesized mean → one tail test / right tail test
Hₒ → μ≤ μₒ
Hₐ → μ> μₒ
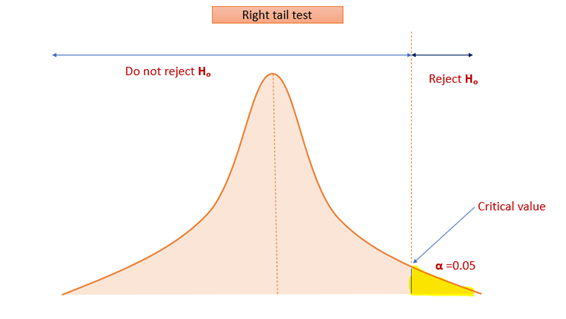
Here, in the alternative hypothesis, we have greater than symbol. So, the rejection area is on the right side. So, it’s a right-tail test.
3. Null hypothesis → Population mean is greater than or equal to hypothesized mean → one tail test / left tail test
Hₒ → μ≥ μₒ
Hₐ → μ< μₒ

Here, in the alternative hypothesis, we have less than symbol. So, the rejection area is on the left side. So, it’s a left-tail test.
One sample/Two-sample test
- One sample
One sample test is a test performed on one sample and compares its value with the population parameter. - Two sample test
Two types of two-sample test
- independent samples — Two samples test is a test performed on 2 random samples drawn independently from 2 different population
- paired-samples — Two-sample test when performed on the same group before and after treatment.
Example. Weight of people before and after joining the gym. [same set of people]
Parameter of Interest
Next, we have to check the parameter of interest.
- Test of mean
- Test of variance
- Test of proportion
Step 3: Determine the type of testing.
[ Example. One tail, test of mean, one sample test]
Test Statistic
We have to compute test statistic from sample data. In hypothesis testing, we are dealing with three population parameters. [mean/variance/proportion]
1. Test of mean
If population standard deviation is known, compute test statistic using Z test
Z test
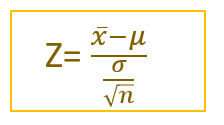
x̅ → sample mean
μ → population mean
σ → population standard deviation
n → sample size
If population standard deviation is unknown, compute test statistic using t-test
t-test

x̅ → sample mean
μ → population mean
s → sample standard deviation
n → sample size
Test statistic follows t-distribution with n-1 degrees of freedom.
t-test is similar to the Z test when the sample increases.
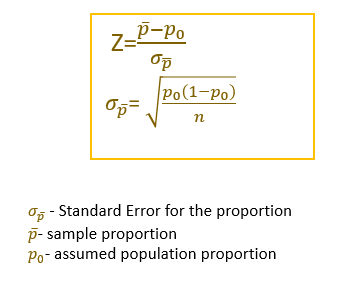
2. Test of proportion
Z test
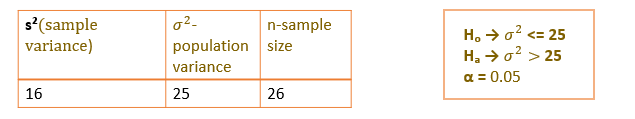
3. Test of variance
chi-square test

n →sample size
s² → sample variance
σ² →population variance
Step 4 in Hypothesis Testing, Compute the test statistic
Three approaches for hypothesis testing
- p-value approach
- Critical value approach
- Confidence Interval Method.
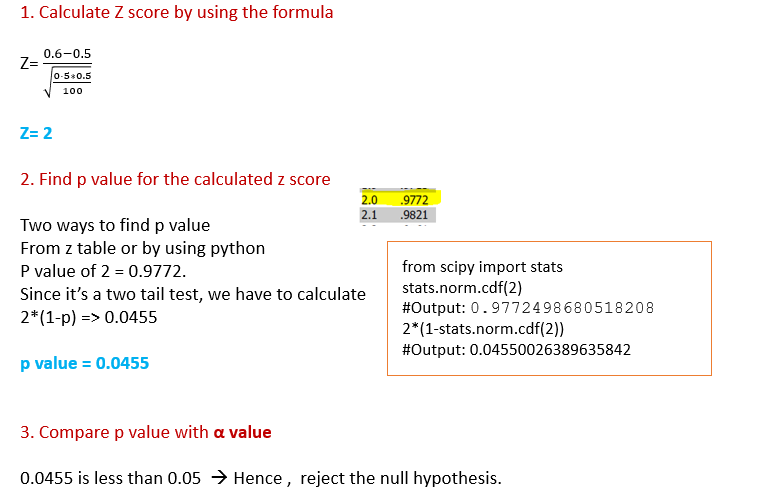
p-value approach
- Calculate Z by using the formula (If population variance is known or use t-test)
- Find p-value for the calculated Z
- Compare the p-value with α (level of significance)
Example: One sample — Test of mean — Left tail


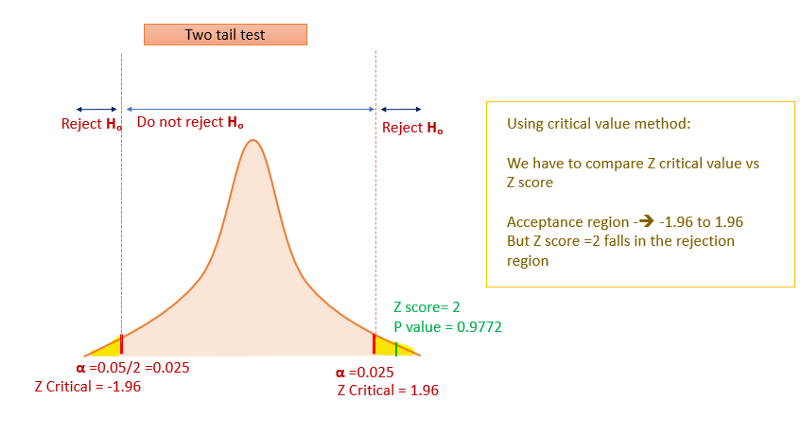
Critical Value Approach
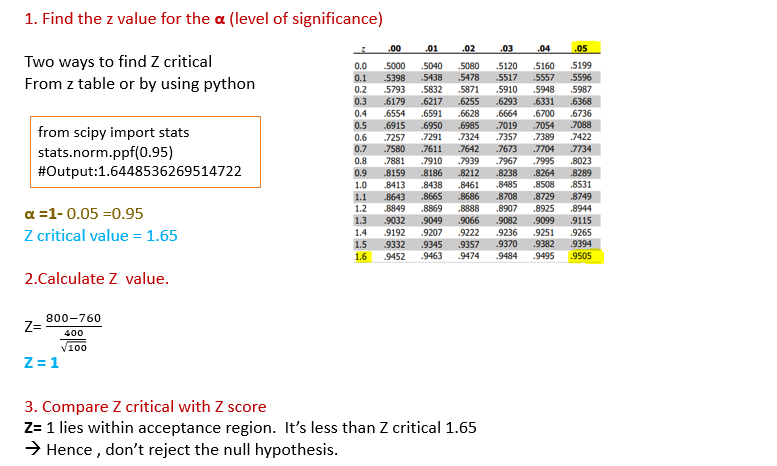
- Find the z critical value for the α (level of significance). This is known as the critical value.
a) For the left tail test, calculate z critical for α
b) For the right tail test, calculate z critical for 1-α
c) For the two-tail test, calculate z critical for α/2 and 1-α/2 - Then calculate Z value by using the formula (If population std deviation is known or use t-test)
- Now compare the critical value against the calculated z value
Example: One sample- Test of mean — Right tail test


p-value vs critical value approach
- In the p-value approach, the decision to reject or not to reject the null hypothesis is made by comparing the probability value.[ p-value vs α ]
- In the critical value approach, the decision is made by comparing the calculated Z value vs critical value.
The end result is the same for both approaches.
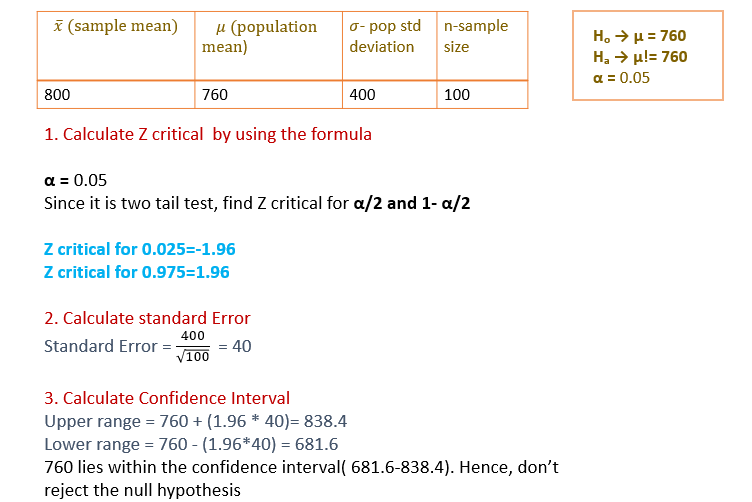
Confidence Interval Approach
Confidence Interval is the range of values in which population parameters can occur. This method is mostly used in the two-tail tests.
Confidence Interval = x̅ ±Z * standard Error
Standard Error = σ/√n
- First, calculate z critical
- Calculate standard error
- Calculate upper range x̅ + Z * standard Error
- Calculate lower range x̅ — Z * standard Error
- Check if the population mean falls in this range. That means do not reject the null hypothesis.
Example: Test of mean — Two tail test — one sample
Step 5: Use either the p-value approach or critical value approach or confidence interval method to make a decision
Test of proportion
Example: Test of proportion — Two tail test — one sample test

Using p-value approach
Test of variance
Chi-square test of variance
We know that the sampling distribution of mean follows a normal distribution.
But sampling distribution of variance doesn’t follow a normal distribution. It follows chi-square distribution which depends on degrees of freedom.

The cumulative probability function runs from right to left. When degrees of freedom increase, variance decreases and tends to follow normal distribution when the sample size approaches population.

Two types of test
- Test of independence
- Goodness of fit
Example:
Using critical value approach
Example: Test of variance — Right tail

Key Takeaways.
- p-value approach
a) right tail test → (1-p) vs alpha value
b) left tail test → p vs alpha value
c) two-tail test → 2(1- p) vs alpha value [if the sample mean is on the right side of distribution mean)
d) two-tail test → 2(p) vs alpha value [ if the sample is on the left side of distribution mean) - Critical value approach
a) right tail test → find critical value for 1-α and compare with the test statistic
b) left tail test → find critical value for α and compare with the test statistic
c) two-tail test → find critical value for α/2 and 1- α/2 and compare with the test statistic
Conclusion:
In this article, I have covered the steps to perform hypothesis testing using different methods [ p-value, critical value, confidence interval method].
I hope you all like it and thanks for reading!
If you like to read more of my tutorials, follow me on Medium, LinkedIn, Twitter.
Make a one-time donation
Make a monthly donation
Make a yearly donation
Choose an amount
Or enter a custom amount
Your contribution is appreciated.
Your contribution is appreciated.
Your contribution is appreciated.
