Drop Values, Fill Values, Replace Values

Handling Missing Values in Pandas
Data Cleaning is one of the important steps in EDA. Data cleaning can be done in many ways. One of them is handling missing values.
Let’s learn about how to handle missing values in a dataset.
Table of Content
- Identify Missing Values
- Replace Missing Values
- Fill missing values
- Drop missing values
Identify Missing Values
Different types of missing values:
- Standard Missing Values
- Non-standard Missing Values
- Unexpected Missing Values
Standard Missing Values
Blank cells, NaN, n/a → These will be treated by default as null values in Pandas.
Standard missing values only can be detected by pandas.
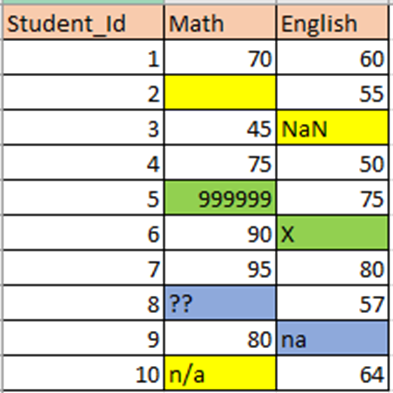
Example: I have created a simple dataset having different types of null values

Let’s import the dataset
df=pd.read_csv(“student.csv”)
df.head(10)
2. df.isnull().sum() → It will return the count of null values in each column.It will count only the standard null values.
df.isnull().sum()

Only 3 standard missing values are counted. [Blank cells, NaN, n/a]
3. df[“Math”].isnull() → It will return a boolean array. True -means null values.
df["Math"].isnull()

Non-Standard Missing Values
Sometimes missing values will be entered like .., __, — , missing, na, @,??,***, etc.
Now let’s check all the unique values in the “Math” and “English” columns. By checking this, we can identify all the non-standard missing values in the dataset.
df[“Math”].unique()

df[“English”].unique()

It will return all the unique values in that particular column. We can identify what are the other values, which are to be treated as “missing values”.
From the two columns unique values, we can identify some missing values like na and ??
These are non-standard missing values.
Unexpected Missing values
Unexpected missing values are identified based on the context of the dataset. Here marks range from 0 to 100 only. So 999999 and X also identified as missing values.
Replace Missing Values
- df.replace(old_value, new_value) → old_value will be replaced by new_value
missing_values=['??','na','X','999999']
df=df.replace(missing_values,np.NaN)
df
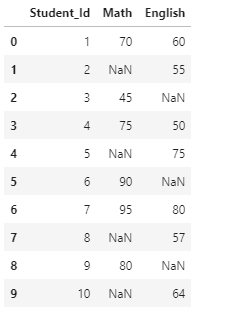
Now all the missing values are replaced with NaN. Now it’s easy to treat all the null values. We can either drop all null values or fill those by mean/median.
Fill Missing Values
Different ways to fill the missing values
- Mean/Median, Mode
- bfill,ffill
- interpolate
- replace
1. Mean/Median, Mode
- Numerical Data →Mean/Median
- Categorical Data →Mode
In columns having numerical data, we can fill the missing values by mean/median.
Mean — When the data has no outliers. Mean is the average value. Mean will be affected by outliers.
[Example. If we are calculating, mean salary of the employees in a room and if the company CEO walks in, the mean will tend to be higher. It can’t be the representative amount. In that scenario, we can choose median]
Median — When the data has more outliers, it’s best to replace them with the median value. Median is the middle value (50%)
In columns having categorical data, we can fill the missing values by mode
Mode — Most common value.
Let’s fill the missing values by mean
- First, we have to check the data type of the column.
df.dtypes

“Math” and “English” are in “object” datatype. We have to convert to “float” datatype to calculate mean.
2. Changing the datatype of the column and calculating mean
df["Math"]=df["Math"].astype("float64")
m=round(df["Math"].mean(),2)
m
Output: 75.83
3. Now filling the missing values in the “Math” column by mean -75.83
df["Math"].fillna(m,inplace=True)
df

Categorical Data
If we want to replace missing values in categorical data, we can replace them with mode(most common value)

- Let’s replace the null value in the “Role” column
df=pd.read_csv("employee.csv")
m=df["Role"].mode()
m
#Output
0    Developer
dtype: object
2. It returns a series object, containing the most common value. We have to select the particular value in the series.
m=df["Role"].mode()[0]
m
#Output:
'Developer'
3. Fill in the value
df["Role"].fillna(m,inplace=True)
df

2. bfill,ffill
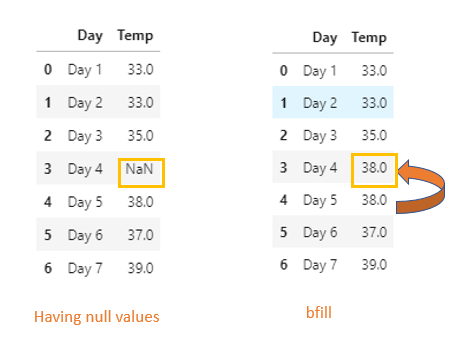
bfill — backward fill — It will propagate the first observed non-null value backward.
ffill — forward fill — it propagates the last observed non-null value forward.
If we have temperature recorded for consecutive days in our dataset, we can fill the missing values by bfill or ffill. It will be more accurate when compared to the mean/median for this type of dataset.

- bfill
df1=pd.read_csv("weather.csv")
df1.bfill(inplace=True)
df1
2. ffill
df1.ffill(inplace=True)
df1

3. Interpolate
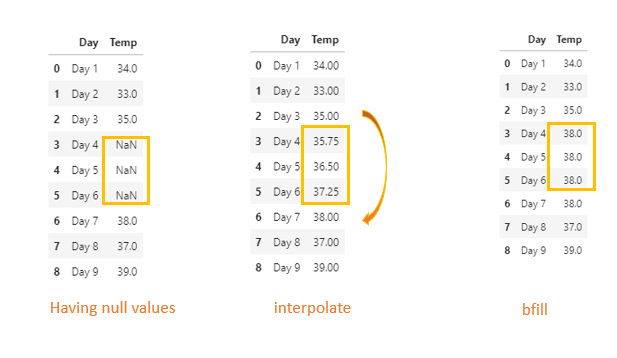
interpolate() is one of the methods to fill the missing values.

We have missing values for three consecutive days. Instead of filling all three rows with the same value, we can use interpolate method.
bfill/ffill will fill the same value for consequent missing values.
df2=pd.read_csv("weather1.csv")
df2=df2.interpolate()
df2
Let’s visualize the dataset after filling consecutive missing values with interpolate method vs bfill
import seaborn as sns
sns.pointplot(x="Day",y="Temp",data=df3,color='darkorange')

From the plot, we could see how the missing values are filled by interpolate method [ by default linear method is used]
4. replace
Sometimes we can replace the specific missing values by using replace method.
Like we can get data from an external source and replace it.
Drop Missing Values
- Removing all the null values in the dataset
df.dropna()

2. Removing the null values in a specific column
df.dropna(subset=["Math"])

Conclusion
Data cleaning involves many steps. I have covered only how to handle missing values in the dataset. There are many more like fixing invalid values, splitting columns, merging columns, filtering subset, standardizing data, scaling data.
Thanks for reading!
Watch this space for more articles on Python and DataScience. If you like to read more of my tutorials, follow me on Medium, LinkedIn, Twitter.
Make a one-time donation
Make a monthly donation
Make a yearly donation
Choose an amount
Or enter a custom amount
Your contribution is appreciated.
Your contribution is appreciated.
Your contribution is appreciated.
