
Logistic Regression in Python
Logistic Regression is used for classification problems in machine learning. It is used to deal with binary classification and multiclass classification. In logistic regression, the target variable/dependent variable should be a discrete value or categorical value.
Binary classification →problems with two class values like male/female, yes/no, True/False, 0/1, pass/fail.
Multiclass Classification →problems with more than 2 class values.
Let’s learn about logistic regression for binary classification in this story.
Topics Covered
- Why not Linear Regression?
- Sigmoid or Logit Function
- LogLoss Function
- Accuracy Score
- Why it is named as Logistic Regression?
- Linear Regression vs Logistic Regression
- Implement Logistic Regression Using sklearn
Why not Linear Regression
Problem: If a student studies for x hrs, how likely will he pass?
It’s a classification problem. Here we have to predict how likely will a student pass/fail. In logistic regression, the target variable should not be string types. We have to convert pass/fail to 0/1. So, the prediction will range from 0 to 1. But in linear regression, the range is from -∞ to +∞.
If we want to predict the marks obtained by a student if he studies for x hours will be a linear regression problem.
Let’s take data of about 20 students, Study hours vs Results(Pass/Fail)

From the data points, we can interpret that more the study hours the results tend be to be 1 (Pass).
If we try to fit a linear regression line, it will look like this.
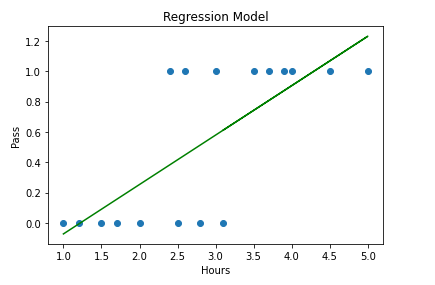
Linear Regression Line range from -∞ to +∞. But for our classification problem, results should belong to either 0 or 1 or we have to predict the probability which is between 0 and 1.
Our data doesn’t look like it will fit in one straight line. We force-fit into one straight line. Most of the data points didn’t pass through that straight line.
Solution:
1. Our line should go through most of the data points.
2. It should range between o and 1.
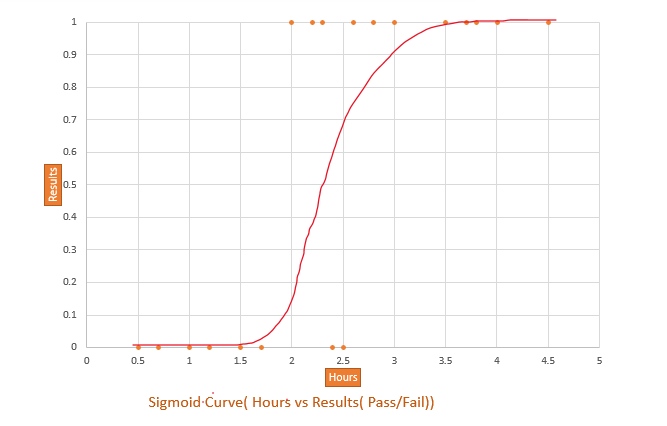
3.Something like a S curve will pass through most of the data points.
4. The best fit line is transformed into S curve using the sigmoid function.
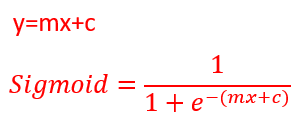
Linear Regression Equation: y=mx+c
The best fit line is transformed into the S curve using this formula.
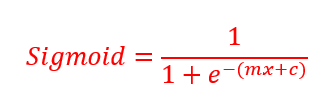
Sigmoid or logit function
Let’s see the interpretation of the sigmoid formula. This function is also known as the Logit function.
e → Euler’s constant

So, by using the sigmoid equation, we can guarantee that y will always between 0 and 1.
There is another interpretation of the same equation.
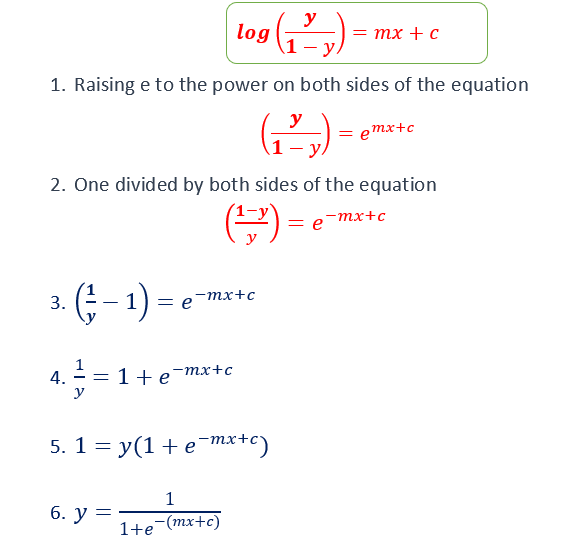
Both the equation are the same.
Log loss Function
How to calculate m and c in the equation?
In the linear regression equation, the best fit line will minimize the Sum of squares errors. The Sum of squares Errors is calculated by finding the difference between the observed value and predicted value. We square all the errors and then sum it up.
In the logistic regression equation, the best curve will minimize the logloss function.

y value will be always o or 1.
ŷ value will be between o and 1.
There are two cases
- If y=0
logloss=-log(1-ŷ)
(because ylog(ŷ) will become 0)
2. If y=1
logloss=-log(ŷ)
[because log(1-ŷ)will become 0]
By minimizing the logloss function, the observed value and predicted value will be closer.
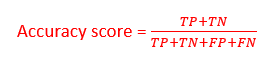
Accuracy Score
The accuracy score is used to determine the overall predicted accuracy of the model.
Confusion matrix
A confusion matrix is a table that is often used to describe the performance of a classification model on a set of test data for which the true values are known. Each row of the matrix represents the instances in a predicted class while each column represents the instances in an actual class (or vice versa)
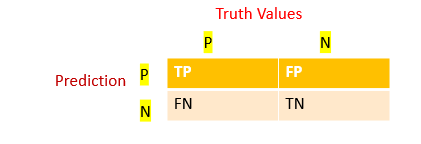
TP → True Positive
FP → False Positive
FN → False Negative
TN → True Negative
Accuracy score
Why it is named as Logistic Regression?
The term “Logistic” derived from “Logit function” which is used for classification.
The term “Regression” is used because we use the technique similar to linear regression.
Linear Regression vs Logistic Regression

Implement Logistic Regression Using sklearn
- Import the libraries
- Load the data
- EDA
- Data Wrangling(Cleanse the data)
- Assign features to x and y
- Train and Test
- Calculate Accuracy
- Prediction
1.Import the libraries
import numpy as np
import pandas as pd
import seaborn as sns
import matplotlib.pyplot as plt
2.Load the data
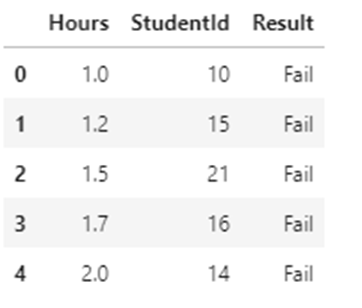
Dataset — results.csv contains hours vs results. [Number of hours students studies vs their results Pass/Fail].It contains StudentId column also.
df=pd.read_csv("results.csv")
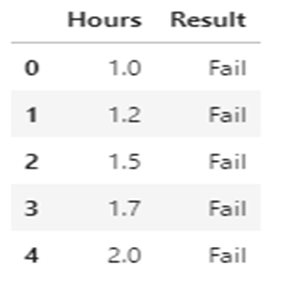
df.head(5)
df.shape
(20,3)
The dataset contains 20 rows and three columns
df.info()
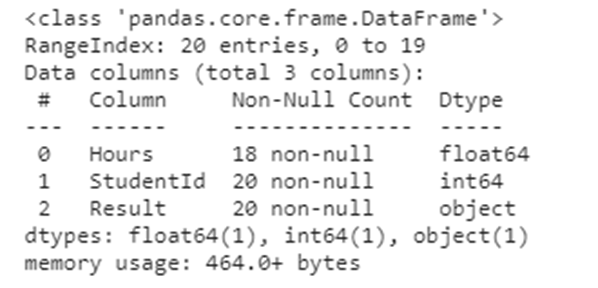
It contains three columns Hours, StudentID, and Result
3. EDA
Analyze data by creating different plots to check the relationship between variables.
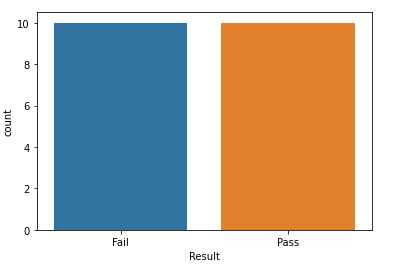
sns.countplot(x="Result",data=df)
Scatter plot
plt.scatter(df.Hours,df.Result,color='red')
plt.xlabel("Hours")
plt.ylabel("Pass")

From the scatterplot, we can interpret that students who studied for more hours are more likely to pass the exam.
4. Data wrangling
- Check if there is any missing data
df.isnull().sum()
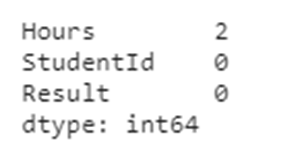
Only the Hours column has 2 missing data. We can drop that rows. If our dataset has many columns means, we can’t drop the rows. We may in need of data from other columns, in that scenario we can replace the missing values by mean.
df.dropna(inplace=True)
df.shape
(18,3)
Two rows that have missing values are removed. Only 18 rows in the dataset now.
- Remove column which is not needed
In our dataset, StudentID column is not needed. We are not going to do any analysis on the StudentID column. We are going to predict the Result based on the number of hours students studied.
df1=df.drop("StudentId",axis=1)
df1.head()
StudentID column is removed now from the dataset.
- In logistic regression, it won’t deal with string data types. We have to predict the Results → Pass/Fail. We can convert that column to discrete variables 0 and 1.
result=pd.get_dummies(df["Result"])
result.head(3)
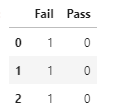
Now we can keep either Fail/Pass column and drop the other one.
result=pd.get_dummies(df["Result"],drop_first=True)
result.head(3)
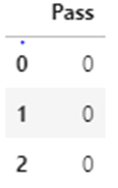
In Pass column, 0 indicates Fail and 1 indicates Pass.
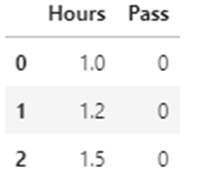
Now concatenate the Pass column to the dataframe
df1=pd.concat([df1,result],axis=1)
df1.head(3)

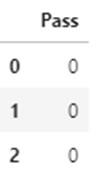
Now we can drop the Result column from the dataframe.We have converted the Result column into Pass column.
df1=df1.drop("Result",axis=1)
df1.head(3)
5.Assign Features to x and y
x=df1.iloc[:,0:1]
x.head(3)

y=df1.iloc[:,1:]
y.head(3)
6. Train and Test the data
from sklearn.model_selection import train_test_split
xtrain,xtest,ytrain,ytest=train_test_split(x,y,test_size=0.2,random_state=2)
from sklearn.linear_model import LogisticRegression
log_reg=LogisticRegression()
log_reg.fit(xtrain,ytrain)
7.Calculate Accuracy
predictions=log_reg.predict(xtest)
from sklearn.metrics import confusion_matrix
cm=confusion_matrix(ytest,predictions)
print (cm)
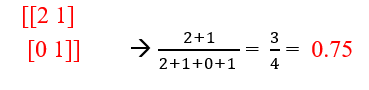
Output:
[[2 1]
[0 1]]
from sklearn.metrics import accuracy_score
accuracy_score(ytest,predictions)
Output: 0.75
Accuracy score is 0.75.
8. Prediction
Let’s predict, if a student studies for 7 hours, how likely will the student pass?
log_reg.predict(np.array([[7]]))
Output: array([1], dtype=uint8)
1 indicates Pass.
Predicting the probability
log_reg.predict_proba(np.array([[7]]))
Output:array([[0.00182823, 0.99817177]])
0.00182823 → indicates the probability that the student will fail
0.99817177 → indicates the probability that the student will pass
Github link.
The code used here can be downloaded as a Jupyter notebook from my GitHub.
My other blogs on Machine learning
Understanding Decision Trees in Machine Learning
Naive Bayes Classifier in Machine Learning
An Introduction to Support Vector Machine
An Introduction to K-Nearest Neighbors Algorithm
I hope that you have found this article helpful, thanks for reading!
Make a one-time donation
Make a monthly donation
Make a yearly donation
Choose an amount
Or enter a custom amount
Your contribution is appreciated.
Your contribution is appreciated.
Your contribution is appreciated.
