
Confusion Matrix
In machine learning, the confusion matrix helps to summarize the performance of classification models. From the confusion matrix, we can calculate many metrics like recall, precision,f1 score which is used to evaluate the performance of classification models.
In this blog, we will learn about the confusion matrix and the metrics calculated from the confusion matrix.
Table of Content
- Classification Accuracy
- What we need Confusion Matrix?
- What is the Confusion Matrix?
- Terminologies used in Confusion Matrix
- Metrics Calculated from Confusion Matrix
1.Precision
2. Recall - Which metric to choose precision or recall?
- F1 Score
- F1 Score vs Accuracy
- Calculating metrics from the confusion matrix
- Confusion matrix using scikit learn
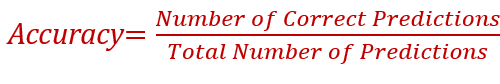
Classification Accuracy
In Machine learning for classification models, Accuracy is one metric used to evaluate the performance of the model.
Why we need Confusion Matrix?
Example: If we have a data set[cancer prediction] of 100 records, and if the accuracy is 95% means, the model predicts 95 records correctly. 5 records are predicted wrongly.
Error is said to be 5%. We can’t predict what type of error is this? Two types of errors are possible.
- 1 [malignant-cancer] is predicted as 0[benign- no cancer]
- 0[benign-no cancer] is predicted as 1[malignant-cancer]
Out of these two errors, for this model, first, one is considered to be risky. Because if a cancer patient is mispredicted, their condition will become worse without treatment.
If a non-cancer patient is predicted as cancer means, he/she may go for another screening and will get the correct result in the next screening. So, this error is not risky.
If those 5 misclassified records belong to the first category (Cancer patients predicted as no cancer) means, it will be very risky. From the accuracy metrics, we can’t evaluate the performance of the model.
So, we go for a confusion matrix which breaks down the type of error also.
What is the Confusion Matrix?
A confusion matrix is a n*n matrix that is used for evaluating the performance of the classification model.
For Binary classification — The confusion Matrix is a 2*2 matrix.
If the target class is 3 means Confusion Matrix is 3*3 matrix and so on.

Terminologies used in Confusion Matrix
- True Positive → Positive class which is predicted as positive.
- True Negative → Negative class which is predicted as negative.
- False Positive → Negative class which is predicted as positive.[Type I Error]
- False Negative →Positive class which is predicted as negative.[Type II Error]
False Positive(FP) is also known as Type I Error.False Negative(FN) is also known as Type II Error
Metrics Calculated from Confusion Matrix
1. Recall
Recall is a measure of how many positives your model is able to recall from the data.
Out of all positive records, how many records are predicted correctly.
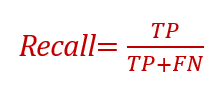
Recall is also known as Sensitivity or TPR (True Positive Rate)
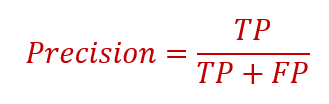
2. Precision
Precision is the ratio of correct positive predictions to the total positive predictions.
Out of all positives been predicted, how many are actually positive.

Which metric to choose precision or recall?
Both precision and recall are used for evaluating the performance of the model. Which one to chose depends on the problem we aim to solve.
Recall — Example
Cancer Prediction-For this dataset, if the model predicts cancer records as non-cancer means it’s risky. All our cancer records should be predicted correctly.
In this example, recall metrics is more important than precision. The recall rate should be 100%. All positive records( cancer records) should be predicted correctly. False Negative should be 0.
For this cancer dataset, recall metrics is given more importance while evaluating the performance of the model.
If non-cancer records are predicted as cancer means it’s not that risky.
Example. The cancer data set has 100 records, out of which 94 are cancer records and 6 are non-cancer records. But the model is predicting 90 out of 94 cancer records correctly. Four cancer records are not predicted correctly [ 4 — FN]

Precision — Example
Email Spam Filtering– For this dataset, if the model predicts good email as spam means it’s risky. We don’t want any of our good emails to be predicted as Spam. So, the precision metric is given more importance while evaluating this model. False Positive should be 0.
If the spam filtering dataset has 100 records, out of which 94 are predicted as spam emails. Only 90 out of 94 records is predicted correctly. 4 good emails are classified as spam. It’s risky. The precision rate is 95%. It should be 100%. No good emails should be classified as “Spam”. False-positive should be 0 for this model.

F1 Score
F1 score is a harmonic mean of precision and recall.
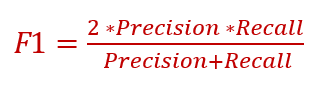
F1 score metric is used when you seek a balance between precision and recall.
F1 score vs Accuracy
- Accuracy deals with True positive and True Negative. It doesn’t mention about False-positive and False-negative. So we are not aware of the distribution of False-positive and False-negative. If accuracy is 95% means, we don’t know how the remaining 5% is distributed between False-positive and False-negative.
- F1 Score deals with False-positive and False-negative. For some models, we want to know about the distribution of False-negative and False positive. For those models, the F1 Score metric is used for evaluating the performance.
Calculating metrics from the Confusion Matrix
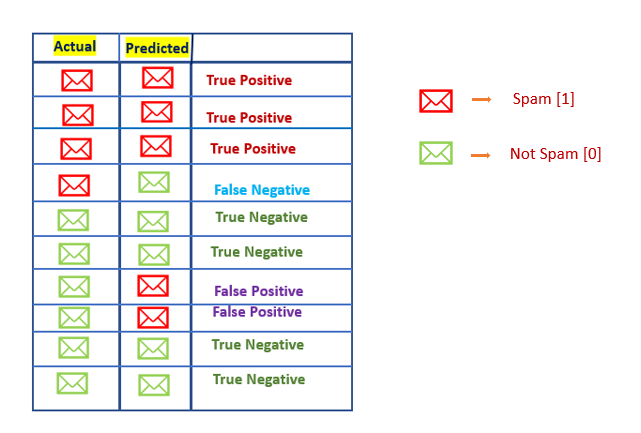
Let’s take the “Email Spam Filtering” example. Our task is to detect spam emails. So spam emails are marked as 1 and not spam emails are marked as 0.
I have taken 10 records. Let’s say our model prediction looks like this.
Let’s calculate metrics from the confusion matrix.
- Calculating Precision, Recall, F1 Score from the confusion matrix.

2. Calculating Accuracy from the confusion matrix.

Now let’s calculate the same metrics using scikit learn
Confusion matrix using scikit learn
I have taken the same example mentioned above. I have assigned spam class as 1 and non-spam as 0. Let’s say our model prediction looks like this.

- Confusion Matrix
from sklearn.metrics import confusion_matrix
actual = [1, 1, 1, 1, 0, 0, 0, 0, 0, 0]
predicted = [1, 1, 1, 0, 0, 0, 1, 1, 0, 0]
cm = confusion_matrix(actual, predicted)
print(cm)
#Output:
[[4 2]
 [1 3]]
To show the class in the confusion matrix.
pd.crosstab([actual],[predicted])

2. Accuracy Score
from sklearn.metrics import accuracy_score
print (accuracy_score(actual,predicted))
#Output: 0.7
3. Classification report
from sklearn.metrics import classification_report
print (classification_report(actual,predicted))
#Output
              precision    recall  f1-score   support
0              0.80      0.67      0.73         6
1              0.60      0.75      0.67         4
accuracy                           0.70        10
   macro avg       0.70      0.71      0.70        10
weighted avg       0.72      0.70      0.70        10
Process finished with exit code 0
support → tells the number of records.

Visualize confusion matrix using seaborn
import seaborn as sns
sns.heatmap(cm, annot=True)

Conclusion
Classification output can be either class output or probability output. For classification problems with class output, the confusion matrix is used. In this article, we have learned about calculating metrics for classification problems with class outputs. For classification problems with probability output, ROC Curve is used.
Happy Learning!
Make a one-time donation
Make a monthly donation
Make a yearly donation
Choose an amount
Or enter a custom amount
Your contribution is appreciated.
Your contribution is appreciated.
Your contribution is appreciated.
